OMAN-Tel
[LS-597] Crash of Jboss during NON IP XML Created: 26/Aug/25 Updated: 13/Nov/25 Due: 29/Aug/25 Resolved: 13/Nov/25 |
|
| Status: | Cancelled |
| Project: | L3 Support |
| Component/s: | NEP |
| Affects Version/s: | None |
| Fix Version/s: | None |
| Type: | Bug | Priority: | Normal |
| Reporter: | Abir Messaikeh | Assignee: | Abir Messaikeh |
| Resolution: | Fixed | Votes: | 0 |
| Labels: | None | ||
| Remaining Estimate: | Not Specified | ||
| Time Spent: | Not Specified | ||
| Original Estimate: | Not Specified | ||
| Attachments: |
|
| Customer: |
OMAN-Tel
|
| Planned Start: | |
| Planned End: | |
| Product: | NEP |
| Description |
|
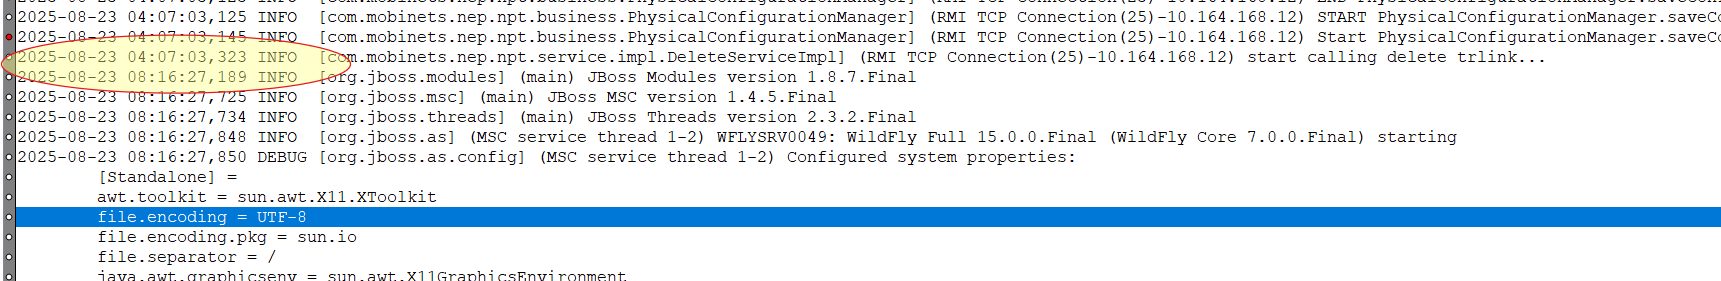
As previously reported, the NEP is crashing when processing NON-IP XML files. I have checked the system, and both memory and CPU usage appear to be normal. Additionally, there are no major errors in the logs. It's failed at this point during the PhysicalConfiguration process. After restart the Jobss, we executed the IP XML import, which extended for more than 8 hours and not finished. During this process, a 'DEADLOCK APPARENT' error was encountered.. 2025-08-23 14:58:25,476 INFO [com.hazelcast.util.HealthMonitor] (hz._hzInstance_1_dev.HealthMonitor) [10.164.168.12]:5701 [dev] [3.2.5] memory.used=305.4G, memory.free=10.6G, memory.total=316.0G, memory.max=316.0G, memory.used/total=96.64%, memory.used/max=96.64%, load.process=59.00%, load.system=59.00%, load.systemAverage=2198.00%, thread.count=343, thread.peakCount=384, event.q.size=0, executor.q.async.size=0, executor.q.client.size=0, executor.q.operation.size=0, executor.q.query.size=0, executor.q.scheduled.size=1, executor.q.io.size=0, executor.q.system.size=0, executor.q.operation.size=0, executor.q.priorityOperation.size=0, executor.q.response.size=0, operations.remote.size=0, operations.running.size=0, proxy.count=0, clientEndpoint.count=0, connection.active.count=0, connection.count=0 Please find the logs for your reference. |
| Comments |
| Comment by Hassan Abdine [ 26/Aug/25 ] |
|
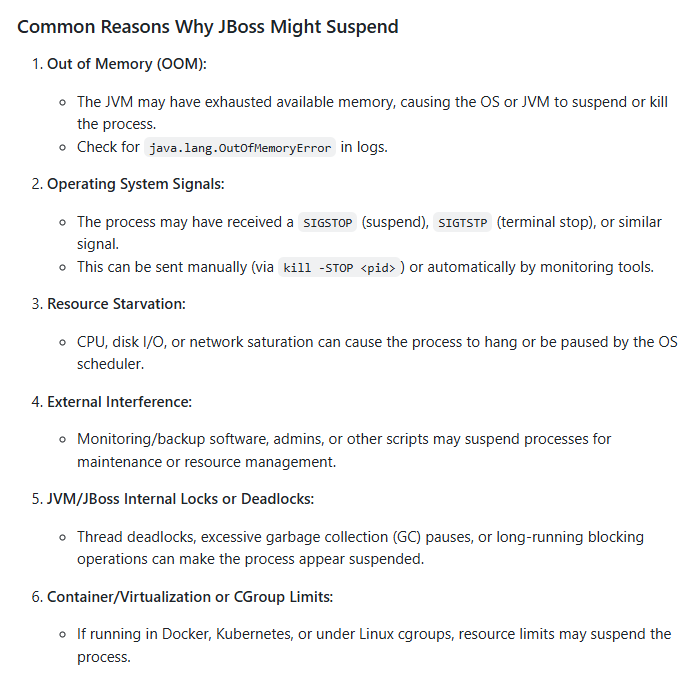
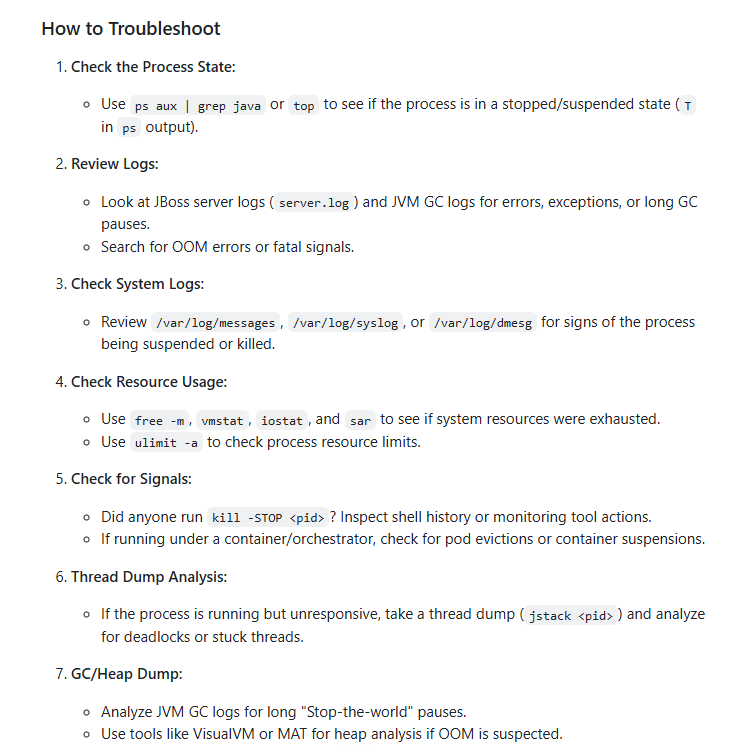
On which platform ? Did you try multiple times with same behavior ? There is no clear exception in the log, only seems the JBoss process is suspended/killed. Therefore, the DEV cannot do anything with it, as most probably seems to be a platform issue.
Some hints:
|
| Comment by Anonymous [ 06/Nov/25 ] |
|
Based on our monitoring and analysis, we determined that the issue originated from suboptimal Java heap memory configuration. To resolve this, we revised the Xms and Xmx settings and enabled G1 Garbage Collection (G1GC). This optimization improves memory allocation efficiency and enhances garbage collection behaviour across both the young and old generations |
| Comment by Nebiat Getahun [ 06/Nov/25 ] |
|
Based on our monitoring and analysis, we determined that the issue originated from suboptimal Java heap memory configuration. To resolve this, we revised the Xms and Xmx settings and enabled G1 Garbage Collection (G1GC). This optimization improves memory allocation efficiency and enhances garbage collection behaviour across both the young and old generations. |
| Comment by Abir Messaikeh [ 13/Nov/25 ] |
|
fixed by L2 team |